
Today we solemnly remember a great massacre that took place in Tiananmen Square Beijing on this day 31 years ago.
It’s not something we’d highlight every year from a global macro perspective, but given everything that’s going on in the world today, it seems only fitting to pay respects to a popular uprising that met a bitter end at the hand of an authoritarian government with the hope that the lessons of history are carried forward.
Still, in light of what we’ve been writing about these last few days, namely the disconnect between the rising stock market and the prevalent unrest in the U.S., the extreme cognitive dissonance has been ebbing at my brain and I’d like to give a more formal outlook.
Evamarie Augustine, an equity analyst at Quantum Economics, made an excellent point yesterday that I hadn’t previously considered, which she clearly explained in this fantastic post. She noted that riots don’t usually have any affect on stocks anyway.
To the list of examples that Evamarie brings in the article, I’d like to add the Shanghai Composite Index in the year 1989, which using the power of hindsight would have been a beautiful time to enter the market.
(Note: This graph is in log scale for emphasis of percentage gain. Also, it begins in 1990, as that’s when the Shanghai Composite began.)
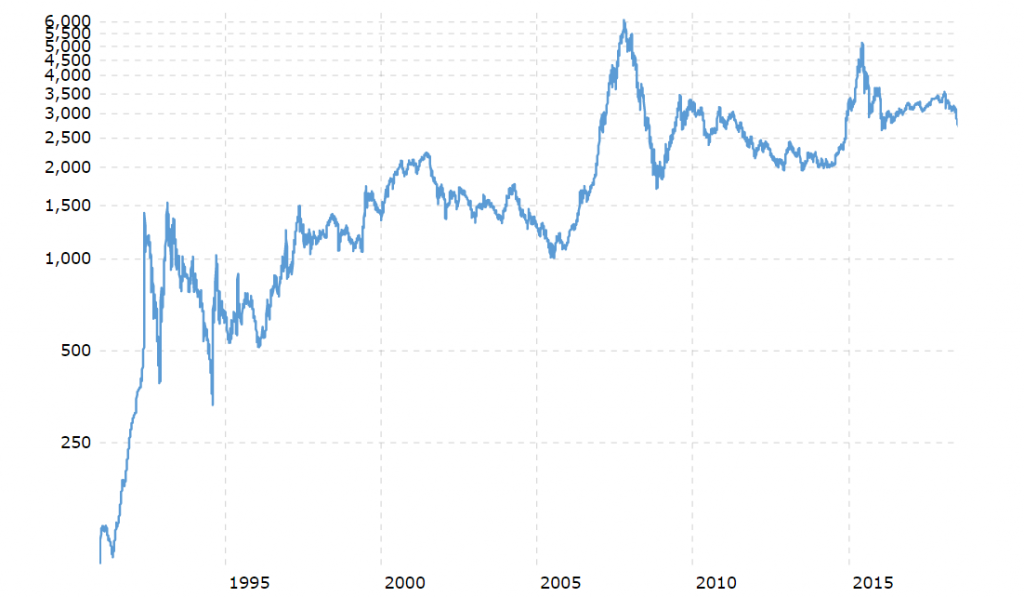
At the moment, the market is pricing in a picture-perfect scenario where the Black Lives Matter protests come to a speedy recovery and the economy snaps right back to where it was before COVID-19. So let’s hope that that’s what happens.
More than Expected
Meanwhile, the world’s central banks continue to create money at a faster pace than ever. Today, it was the Europeans who announced a shock and awe campaign of €600 billion through the next year, bringing the total stimulus provided by the European Central Bank (ECB) to €1.35 trillion. So that’s certainly a lot.
It was widely expected that they’d come out swinging today, but the final figure puts the consensus estimate to shame, as most market participants were expecting only a half-trillion euro package.
Yes, the ECB has revised their economic forecast downward, even from the dismally low outlook that they had in March, but that’s not why they chose to come out strong handed today.
The bigger issue, from the central bank’s perspective, is inflation, or lack thereof. For the year 2020, they’re expecting just 0.3% inflation, and for an uptick to 0.8% next year, far below their target of around 2%.
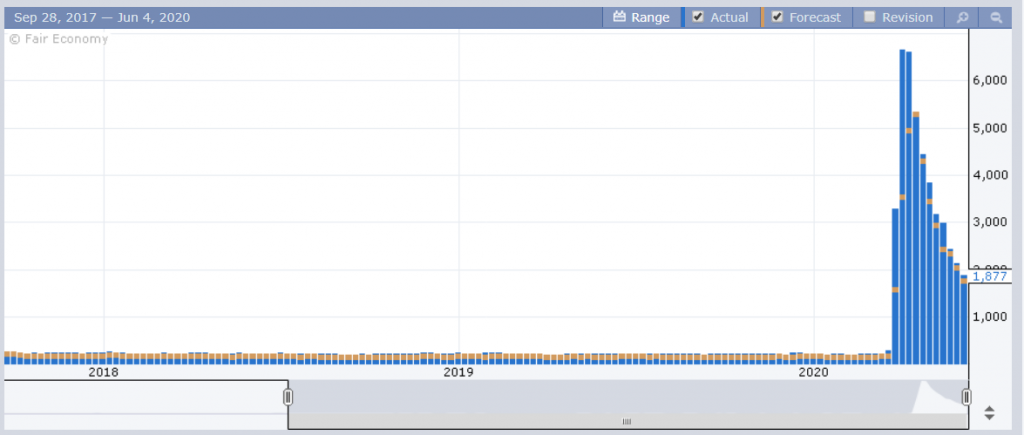
Over in America, the weekly unemployment figures came out this morning showing a staggering loss of 1.8 million jobs. The good news is that analysts were able to accurately forecast the correct figure.
Also, it’s quite clear that there’s now a downward slope in the data, and as the markets are doing their best to look forward to when coronavirus will be behind us, the impact on stocks was somewhat muted.
Tomorrow’s monthly jobs report, on non-farm payrolls, will reveal a lot more about the current economy.
Yesterday, the Nasdaq Index briefly touched a new all time high, but today, things are pulling back a bit. To see prices declining even slightly on a day of great ECB action is admittedly a little odd.
The Red Dots are Out
There were a few weeks there where the network was backed up due to the sudden reduction in hash power, but I’m glad to report that block times, transaction fees, and even the hashrate are now back to levels that are comparable to what they were before the halving.
This brings us into the next wave of bitcoin’s price cycle. Though we only have two examples of previous halving events, the price begun to rise approximately one month after the event, begging a brand new massive bull run each time.
Proponents of the Stock to Flow model call this the red dot period, as the S2F chart is updated with it’s first red dot, indicating the most possible amount of months until the next halving.
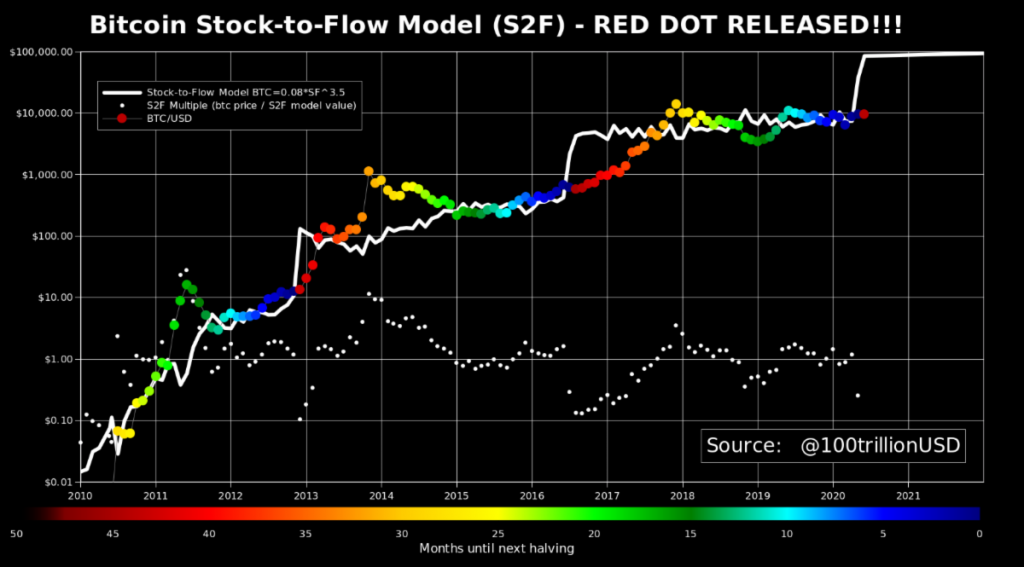
Many bitcoiners on Twitter have even added a red dot emoji 🔴 to their name. Such a ceremonious lot they can be sometimes. 🙂
